
More Xanomeline Data On Cognitive Outcomes
A new analysis that suggests some benefits in cognitively impaired schizophrenics at baseline

In my first essay discussing the EMERGENT-3 trial — the Phase 3 study of xanomeline-trospium (Cobenfy) — I touched on the fact that the study designers had included cognitive functioning as an exploratory endpoint, but hadn’t included it in the data presented:
Cognition was an exploratory endpoint — along with change in baseline prolactin, response based on SNP schizophrenia subtypes and SNPs related to KarXT metabolism. They performed an automated neuropsych battery at baseline, Day 21, and Day 32 of the study. None of the exploratory endpoints were reported so I can’t draw any firm conclusions about why there’s no cognitive data, though you’d think it’s the sort of thing that they would have included in this paper if the readouts were positive.
Now that data has been published in the March edition of AJP1 with the very, erm, descriptive title: The Impact of Xanomeline and Trospium Chloride on Cognitive Impairment in Acute Schizophrenia: Replication in Pooled Data From Two Phase 3 Trials.
The “two phase 3 trials” are EMERGENT-2 and EMERGENT-3, of course. Just to refresh ourselves, these studies were 5 week, double-blind RCTs with a combined total of 307 patients. Participants were treated with xanomeline-trospium as monotherapy, in an inpatient setting, for non-treatment resistant schizophrenia.
At study entry, week 3, and week 5, a set of four subtests from the CANTAB2 were used to test cognitive outcomes in four cognitive domains that have been consistently identified as impaired in individuals with schizophrenia. I think it’s at least semi-useful to understand what these tests are, what they test for, and what they actually look like, so let’s take a brief look at each.
One Touch Stockings of Cambridge (OTS)
OTS is a Towers of Hanoi analogue which tests executive function by way of spatial planning + working memory. It’s easiest to grasp this task just by seeing an example yourself:

The goal is to figure out — purely by looking at the image — how many moves it will require to get from the starting configuration to the target configuration, and then touch the number on the bottom of the screen. Difficulty increases by increasing the complexity of the rearrangements required to reach the target configuration. The metric measured here was the number of questions answered correctly on first response.
(Forward) Spatial Span (FSS)
FSS tests short-term visual memory and is basically just a fancier version of the Simon Says toy. You get 10 white boxes randomly placed on the screen, a subset of which flash a color, one at a time. The task is to tap the boxes in the order that they changed color; what the colors are is irrelevant. Again, it’s easier to just see it. (Despite this video being from the people that literally create and sell CANTAB, they do not include what the test takers are supposed to do in response to the questions, but you should get the idea with the explanation):
With each successful trial, the number of the ten boxes that change color is incremented by one. The longer the sequence a subject can remember before making an error, the higher their score.
Rapid Visual Information Processing (RVIP)
RVIP obviously tests… sustained recall, actually. The subject is given a string of digits that they are supposed to recognize (e.g. 3-5-7), and then shown a sequence of numbers one at a time. The task is to press a button every time they see that sequence of numbers appear. Again, a video illustrating the concept (this one is actually good)
The success metric here is something called A' (aka A-prime), which is “a signal detection measure of response sensitivity to the target, regardless of response tendency [range is 0–1].” I don’t really understand what this means, hopefully some of you do.
Verbal Recognition Memory (VRM)
No misdirection this time; VRM tests verbal recall and cognition. A series of 15 words are shown on the screen — one at a time, of course — and then the subject is asked to recall as many as they can from memory. Then, they are given a pair of words (one of the 15 and a distractor) and asked to identify which they previously saw.
The metric here is very simple: number of words recalled. More words better.
Outcomes
At first glance, this inquiry looks like a total bust. There was a high likelihood that the difference in cognitive outcomes between the treatment and placebo groups were due to chance (p=0.272). Even if a real effect did exist, it was quite small (Cohen’s d = 0.13).

Of course what comes next (and probably the only reason this got published in AJP), is a post-hoc subgroup analysis. Usually, these are a sign that someone has gone rummaging around in the statistical trash bins looking for any subgroup that will give them a p-value <0.05 and a ticket to publication. Here, though, I think the authors’ post-hoc analysis makes good sense and is worth walking through.
The argument is basically this: (1) Not everyone with schizophrenia is cognitively impaired relative to the general population. (2) We haven’t really found any drugs that consistently improve cognitive functioning in normal individuals (except maybe stimulants?), so we probably shouldn’t expect xanomeline to improve cognition in all schizophrenics. (3) However, xanomeline has some cognitive benefits in Alzheimer’s, a condition were patients are cognitively impaired by definition. (4) So, what if we separated out a subpopulation of cognitively abnormal individuals with schizophrenia and ask if xanomeline has a unique effect amongst those individuals?
The paper divided participants into two subgroups based on how their aggregate score for the four CANTAB subtests compared to a norm-based score generated from a population of healthy controls. Individuals whose performance was within 1 standard deviation of the norm-based average were classified as within-normal-limits; I’m going to call them the WNL group. Individuals with scores below that cutoff were classified as impaired. These results are substantially more interesting:

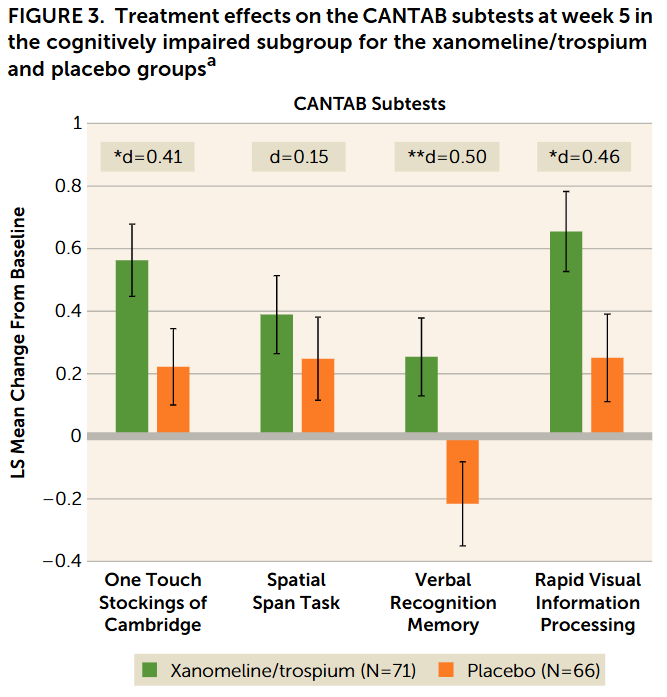
Just eyeballing it, the impaired group looks like it has a pretty robust separation from placebo and the statistics bear this out: p=0.004 and d=0.54! If we look at Figure 3 below, we can clearly see improvement across all 4 cognitive domains, though it does not hit statistical significance for the Spatial Span Task (which tests short-term visual memory).
Looking at the supplemental gives us a better sense that there is something unique about what xanomeline is doing for the individuals in the impaired group. Let’s take a look at this scatterplot from the supplement:
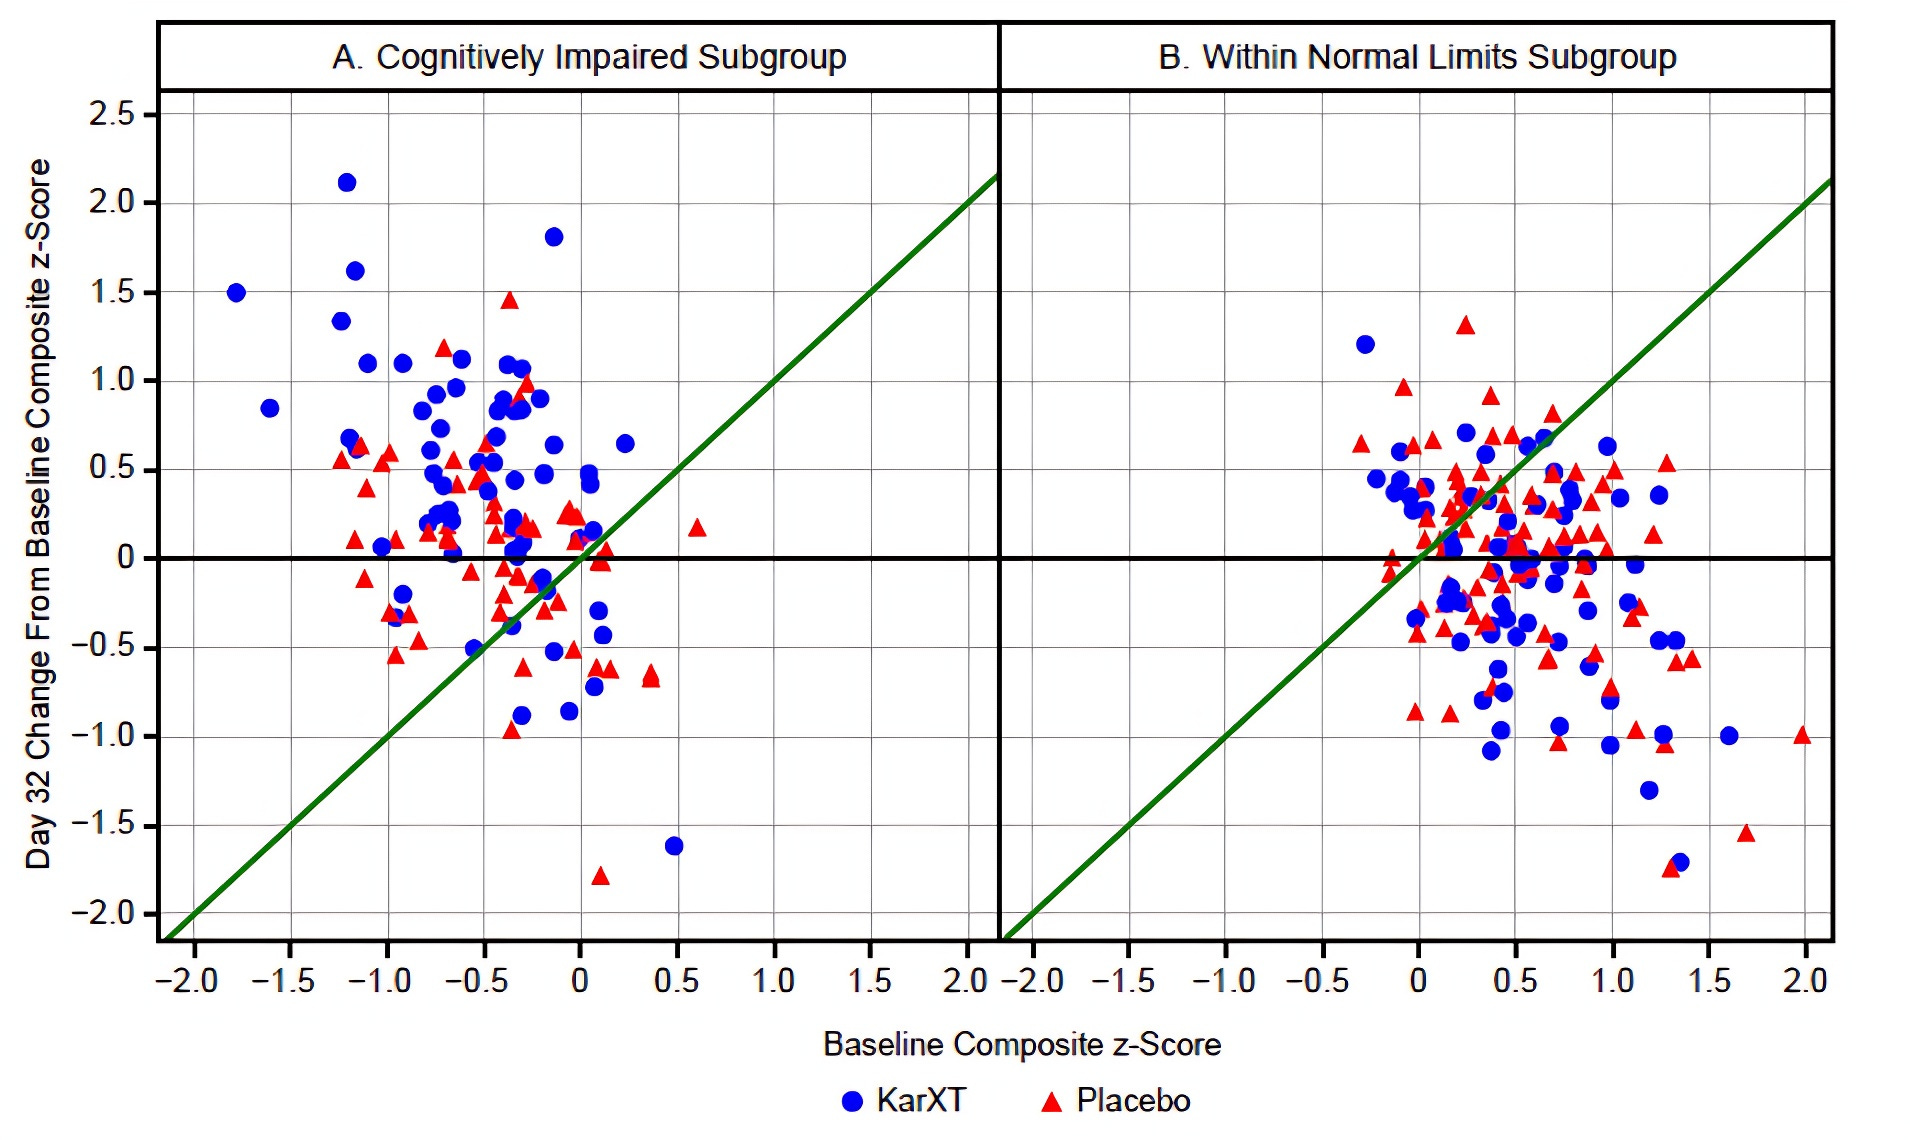
Note that anything above the green line and the x-axis indicates an improvement in the within sample z-score (remember, z-scores are the same as standard deviations) between baseline and Day 32.
Clearly, there is a regression to the mean effect going on in the WNL subgroup; there’s a pretty similar distribution of triangles and circles below that green line. In the impaired subgroup this regression to the mean is also clearly occurring — and that explains why we see so many placebo subjects improving — but the blue circles predominate once you get past that +0.5 line on the y-axis. I edited the graph below to cutoff any data below +0.5 for the impaired subgroup and above −0.5 for the WNL subgroup to really drive this point home:

Another neat piece of analysis in the supplement was to compare the results if you were to set the z-score cutoff for the impaired group at −1.5 instead of just −1.0.

The bigger the deficit at baseline, the larger the treatment effect size.
Is This Just Symptom Improvement?
That’s the big question here, right? How do we know that these improvements are actually due to improvements in cognitive functioning per se as opposed to the improvements in functioning that you might expect when, say, someone is no longer constantly distracted by auditory hallucinations?
The first clue should be that, when you compare the impaired and the WNL groups, there is no real difference between the average PANSS scores. This holds true whether you are looking at the total PANSS score, the positive, or the negative subscales. You can see the numbers for yourself here:

As an aside, I find this pretty surprising. I would’ve bet that cognitive impairment — in any domain — correlated with symptom severity. Not here, at least.
Anyway, the answer to this question is a pretty resounding “No.” Changes in symptoms had little to do with cognitive improvements:
In the cognitively impaired subgroup, the xanomeline/trospium effect remained significant after accounting for[:]
PANSS total score (LSM difference=0.282, SE=0.1088, p=0.011;d=0.50),
positive symptom score (LSM difference=0.243,SE=0.1088, p=0.027; d=0.43),
and negative symptom score (LSM difference=0.332, SE=0.1088, p=0.003;d=0.58).
For all of my Bayesians out there, the supplement also contains a Bayes Factor analysis for both the treatment and placebo groups in the subset of impaired patients. For those of you not in the know, the Bayes Factor (BF) is a ratio that compares how well two competing hypotheses explain the data. Specifically, it quantifies how much more (or less) likely the observed data are under one hypothesis compared to another, and is expressed as:
So, a small BF means that your null hypothesis (H0) is much more likely than the alternative hypothesis (H1) and vice-versa. Two examples in plain English:
BF = 0.33 means that the null hypothesis is 3-times more likely than the alternative
BF = 10 means that the alternative hypothesis is 10-times more likely than the null
Incidentally, BF = 0.33 is considered to be the cutoff for when a BF is even worth mentioning.
Here are the numbers for the treatment and placebo subgroups from the baseline impaired subjects:

The upshot is that a BF = 0.03 means that it is ~33-times more likely that the change in the CANTAB score is unrelated to the change in PANSS total score. I’d say those are pretty good odds.
Is This A Clinically Meaningful Improvement?
Honestly, unclear. It’s pretty difficult to interpret these results into clinical relevance without some sort of functional outcome. That said, I would’ve liked to see more of an attempt to do so in the discussion. The authors also make this rather difficult by using two different composite scores in their analysis. First, remember that the “impaired” group were defined as having a CANTAB composite z-score of at least −1.0, relative to a sample of healthy individuals. However, in the rest of their comparisons (including in the supplement), they use a composite z-score that is normed to the study population.
If we go back to the supplementary materials, we can use those scatterplots from earlier to help us get a slightly better understanding of how much these individuals improved.

Any points above the green line and outside of the yellow triangle represent patients that improved to a within-sample z-score of at least 0. In other words, their CANTAB composite scores were at or above the average z-score of all participants at baseline at day 32.
Ok, fine, but since the z-score comparisons are based on the study participants as a group, what do we know about them relative to the general population? Well, the authors point out that studies like these may select for a population of schizophrenics that are less cognitively impaired than usual:
Indeed, the mean baseline CANTAB composite score (z) in the full sample was −0.90, with 55% performing within one standard deviation of the healthy normative mean, reflecting relatively low impairment compared with the approximately 80% of individuals with schizophrenia previously found to show cognitive impairment (54).
The take-home idea here is that the average patient in this study is more cognitively intact than the average schizophrenic, so getting the impaired-at-baseline individuals to a z-score of 0 means that they’re above average relative to the universe of schizophrenics as well. This study’s design makes it impossible to say that this improvement will be clinically meaningful, but it does hint in that direction.
Practicalities
Let’s say that we believe this data. What do we do with it?
First, I think this provides yet another compelling reason to consider using xanomeline over the antidopaminergics, particularly in patients who are grossly cognitively impaired. A recent meta-analysis in JAMA Psych, Antipsychotic Drugs and Cognitive Function: A Systematic Review and Network Meta-Analysis, suggests that the antidopaminergics probably do not improve cognition at all.
In higher resource settings, I bet it wouldn’t be that hard to do the sort of rudimentary cognitive testing that was done here to help guide treatment. Maybe I will see about trying this myself? Maybe some of you will tell me that actually this is quite difficult to do and I have no idea what I’m talking about.
If you have other thoughts about what this study means, let me know in the comments. Thanks, as always, for reading!
It was actually available online in December of 2024, so, sorry.
Cambridge Neuropsychological Test Automated Battery. I think this only gets a 6/10 as a backronym. Pronounceable, the words it acronymizes are understandable, but a “can tab” does not relate to a cognitive assessment in any way that I can tell. Is this really the best that the scholars at Cambridge can do?
A question from an ignorant med student... The impaired group was defined as having a Cantab score of -1.0 compared to healthy individuals; (while I have no idea what scale they are using) from my dim recollections, if this executive functioning score is anything like IQ, the impaired group is still within the range of normal functioning, if it's sitting at one standard deviation below the average...
My understanding from observation was that the issue with cognitive impairments in schizophrenia was not that people were within the normal range, but that they were noticeably impaired, more like below 3 standard deviations below... I'm not sure how relevant this research/study population is to the patient with schizophrenia who needs help?
Ignore if I'm totally confused!
About the backronym - they're being self-referential; "Cantab" is the abbreviation that comes after degrees from Cambridge uni eg MA Hons (Cantab). Which is, I dunno.